|
|
|
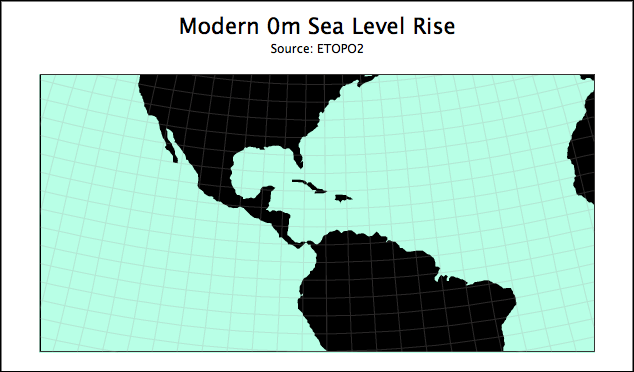  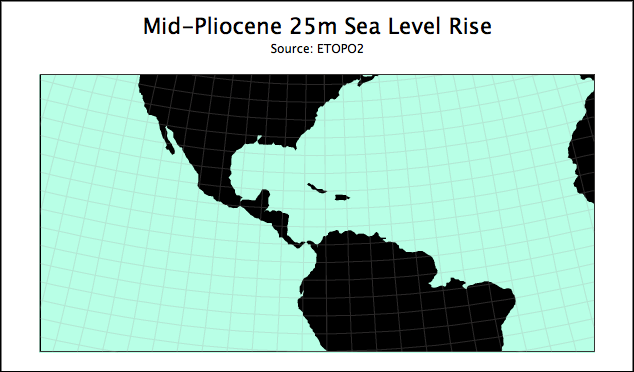 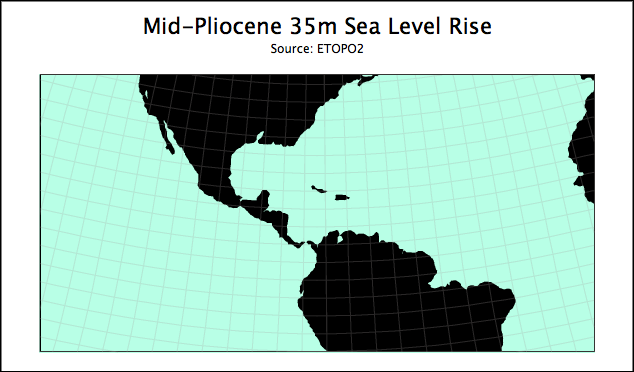 |
Overlays
The ETOPO2 data set was used to generate contour line overlays of the continent outlines for a number of different possible sea levels. The files can be used by any program or programmer that will read the simple format they are in, including the EVA or Panoply software used to visualized the GCM outputs. The files processed from the ETOPO2 data are at ocean levels from -50m below present to 50m above present in 1m increments, and from -500 below to 500 above in 10m increments The format of the files is a list of latitude,longitude pairs. Each separate closed contour line (continent) is separated by the value 9999. For example:
The outline files can be downloaded here |
|